Google Analytics FAQs
- What is Google Analytics?
- Is it really useful? Why do I need to set up Google Analytics?
- Will Google Analytics help me save money?
- How to read Google Analytics Reports?
- What are conversions? Can Google Analytics help track them?
Google Analytics Glossary
- Session?
- Bounce Rate?
- Exit rate?
- Source in Google Analytics?
- Medium in Google Analytics?
- Understanding Different Channels
Reports
What is Google Analytics?
Google Analytics is a Google’s free premium web analytics service started in the year 2005 after acquiring Urchin Software Corporation.
It was started with the aim to measure and track website traffic and to generate data based reports to help businesses make the right move in their search engine optimization (SEO) and marketing efforts.
Is it really useful? Why do I need to set up Google Analytics?
The answer is definitely YES.
It allows you to track your digital marketing activities and provides you with a better insight for which source/medium/channel is working the best for you. Depending on this data you can focus or improve your marketing tactics exponentially.
The users can also improve the website’s performance and can increase the overall revenue by spotting the areas on the website where the users are spending more time. This analysis can easily be done through Google Analytics.
You can know the country, demographics, medium (desktop, mobile or tablet) and many other factors and target your sales or marketing accordingly.
Will Google Analytics help me save money?
If used correctly the answer is Yes.
Wondering how?
Google Analytics gives you insight about how your marketing strategies and channels are performing, and do you need to spend money on a particular channel or not.
For example,
If you have been spending money on running ad campaigns but as per Analytics report, it is not able to generate traffic. Then it’s advisable to spend money on other channel rather than ads.
This way Google Analytics can help you decide better, and ultimately save your money.
What are conversions? Can Google Analytics help track them?
A conversion is the accomplishment of predefined goals by the site owner.
You can define these goals in the Google Analytics which can be visiting a page, form submission, PDF download or any such goal.
Yes Google Analytics can help you track these goals by using the reports under “Conversions” section.
Let us now understand Google Analytics Key Terms
How to read Google Analytics Reports?
Usually all the reports in Google Analytics are generated by comparing two metrics: a Primary and a Secondary metric.
The users can select different options from the drop-down menu of both the groups to compare different metrics. Moreover, it is important to remember here that you can only select one dimension of each metric at a time to generate a report.
What are Primary metrics in Google Analytics
These are the volume metrics, like Sessions or New Users, Goal Value, Goal Completion etc.
What are Secondary metrics in Google Analytics
And these are relative metrics, like Bounce Rate or Pages/Session, Goal Conversion Rate which are formula based factors.
What is a Session?
Just as a user visits your website it is counted as a session. A user can visit n number of pages in one session which typically lasts for 30 minutes.
These 30 minutes can either be activity enriched or even if the user leaves the site unattended for 30 minutes still it will be counted as a session.
A new session begins
- after 30 minutes.
- Or if the source changes. To explain more, when you open the site by typing in and when you open the same site through a paid campaign. Both will be treated as different sessions.
What is a Bounce Rate?
A bounce rate is a calculation of single page session divided by total number of session on your website.
Basically if in a single page session a user exits from a webpage without browsing further then that indicates a bounce.
What is an Exit rate?
Exit rate is the percentage of visitors exiting from your website in a session.
When a user exits from a particular page, irrespective of how many pages the user has visited, then that is called an exit.
Exit rate is calculated by diving Exits by Page Views.
What is a Source in Google Analytics?
Source essentially answers the “where” question. This means that it points to the origin “where” the website traffic generated.
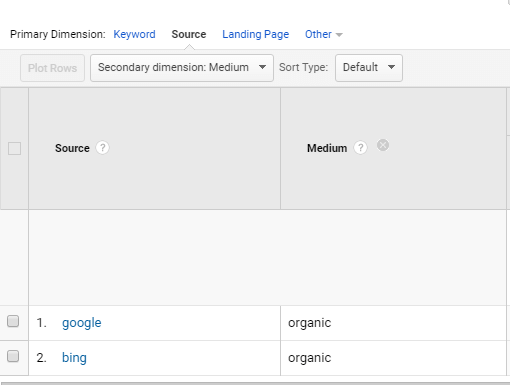
In Google Analytics “sources” are case sensitive. For this reason; Bing, bing, BING are all different sources as per GA.
What is a Medium in Google Analytics?
Medium answers the “How” in a question related to traffic.
It categorizes the traffic generated as per different mediums like Organic, Referral, Direct etc.
Understanding Real-Time Reports in Google Analytics
Real-Time reports allow you to actually see real-time (as it happens) activities on your website.
These reports are updated continuously which can be witnessed by the fact that just as a user visits your website, you will be able to see that information in your Analytics as
- Active Users – users at that very moment on your website
- Pages – track engagement of users just when they are on that page or interacting with an event
- Location – check out the location of an active user
- Traffic Sources – track the source which directed the user to your website
- Conversions – track if any of the active user has made a goal conversion happen
Usage of Real-Time Reports
Made some changes in the content, or started with a new campaign? Real-Time reports can help you track the performance after any change.
You can use Real-Time reports in a number of ways, some of them are:
- Observe and compare the traffic rush between your old and new content. Check if the new content appeals to the search engines and the users
- Calculate the performance of a short-period campaign. Track if it was able to attract users to your website
- Tweeted something, or posted a blog? Now measure the instant reaction of traffic
- Want to check if the tracking code you inserted in your Analytics is working fine or now. Just check the active users log
- Want to see if the changes you made to your website are effective or not? Find it out with goal completion score from active users tab
Audience Reports
Know your users in terms of their demographics, geographic location, device they use etc. to reach out to your website.
This is a very important analysis because as they say,
“Know your users first, the traffic and sales will just follow”.
Active Users in Audience Report
By using this report you can track the number of active users on your website or mobile application for resulting metrics:
- 1-Day Active Users – shows number of active users in a session on the last day of the selected date range. For example the selected date range is 1st August to 28th August, then it will show the active users on 28th
- 7-Day Active Users –no. of active users who triggered a session in data range 22nd August to 28th August
- 14-Day Active Users – active users who started a session in date range 15th August to 28th August
- 28-Day Active Users – total number of active users who begun a session from 1st August to 28th August
If the chart shows a consistent number of active users throughout then you have nothing to worry.
But if,
There is a drop in number of active users then you may want to look into the current marketing strategies, or any recently done change.
It can also mean that you were able to get users to your website, but there wasn’t anything interesting or of their use to keep them hooked to your website. Again, not a good sign.
What is Cohort Analysis in Google Analytics?
A cohort in GA can be defined as a group of users who have been collected in a segment based on a common characteristic.
And this feature is recognized in the Cohort report by an Analytics dimension.
For instance,
Users with the similar Acquisition Date fit in the same cohort group.
Cohort Analysis is useful to track the performance of short-term marketing efforts like single-day offers. By using this report you can track the performance of the users you acquired only in the related time frame.
User Explorer in Audience Report
This is absolutely amazing.
Here you can track individual user behavior in one session on your website.
You can analyze which pages a user visited, how many times he visited, did this interaction convert into a goal, what’s the bounce rate and more.
Benchmarking in Audience Report
By using the Benchmarking reports you can compare your site’s performance with that of industry peers in terms of new users, session etc.
By gaining insights you can set meaningful targets to your marketing campaigns and find out how well or not so well you are doing as per the leading market trends.
Acquisition
Here you can see reports for how you acquire users for your website. This will include the channels, source, medium, social traffic data and other dimensions.
You can gain insights for your paid campaigns by studying the traffic acquired from Google AdWords.
Or,
You can also get the report for your organic SEO efforts by linking your Analytics with your website’s Google Search Console account.
You can also study the social network traffic and traffic from custom campaign tags.
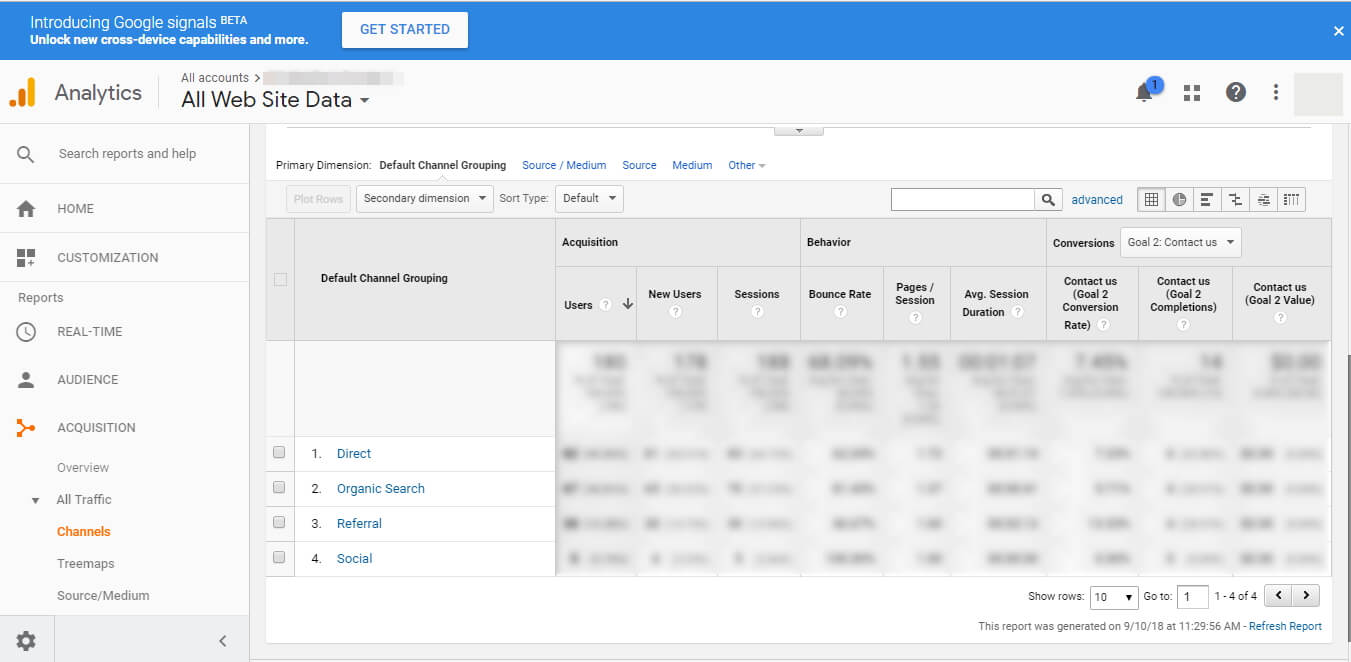
What is a Channel in Google Analytics?
Google Analytics groups the channels of your traffic sources based on predefined rules.
Any regular report includes default channel grouping which is a grouping of the most common sources of traffic, like Paid Search and Direct.
This way you can measure the performance from your traffic channels and can know where to focus more.
Channel |
Answer |
|---|---|
What is Direct Traffic in Google Analytics? |
Not defined traffic source origin or unidentified traffic. This may include type-in traffic, bookmarks generated traffic, traffic from desktop email clients, traffic from documents like PDF, Word etc. and more |
What is Organic Search Traffic in GA? |
It defines the traffic generated by organic search results in search engines like Google, Bing, Yahoo etc. |
What is Social Traffic in Google Analytics? |
The traffic a website gets from social networking sites like Facebook, Twitter etc. |
What is Email Traffic in Google Analytics? |
Email traffic is generated from the medium “email”. For example when you run a email newsletter campaign and you get traffic sourced as; ServiceABC-newsletter/email; then the medium is email and traffic generated from it is email traffic. |
What is Affiliate Traffic in Google Analytics? |
Traffic generated from affiliate marketing channel where you position your product/service on other website and get a commission on every sale. |
What is Referral Traffic in Google Analytics? |
Referral traffic is basically the traffic being pointed to your website from an external website. This can be any site like newdelhiwebsitedesign.com, or facebook.com or any other website which sends a user to your website by clicking on a hyperlink. |
What is Paid Search Traffic in Google Analytics? |
Traffic originated from paid search mediums like; CPC, PPC or paid search. |
What is Display Traffic in Google Analytics? |
The traffic generated from display ads, banners, CPM(Cost Per Mile) etc. |
What is (other) traffic in Google Analytics? |
Other traffic is defined as the traffic generated from sources whose medium is either not pre-defined or not set. If the medium is not pre-defined, but defined by a user via custom tracking parameters “utm_medium” then it’s categorized as other traffic. |
Understanding Treemaps in Audience Reports
The Treemaps report represent trends and data in rectangular boxes with varying size and color for different aspects of data in your acquisition channel.
These reports are a pro to allow you to instantly develop propositions about your inbound traffic.
What is Behavior in Google Analytics?
With the Behavior Overview report you can track the performance of individual pages as opposed to the entire site.
It gives you an indication of pageviews, unique pageviews, average time spent on each page, bounce rate and exit rate.
You can also assess the performance of content by page URLs, titles, search terms or events.
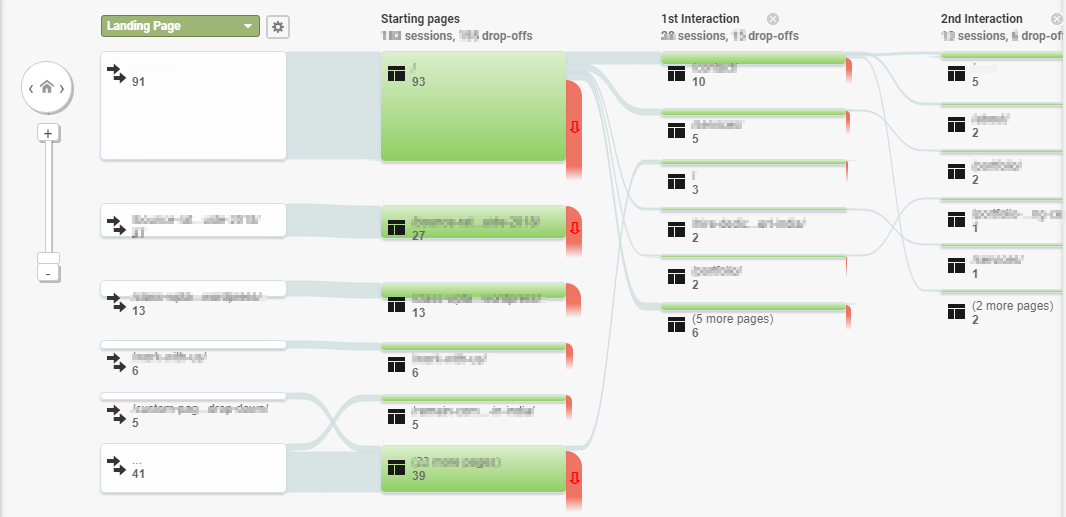
Understanding Behavior Flow in Behavior
By studying the behavior flow reports you can analyze the flow of the path the users take when they visit your website.
With the help of this report you can find out which content is the most engaging among others.
It gives you insight about what landing pages users enter through more frequently to your website.
Also, what’s their first and second interaction from the landing page. This means to track which pages do they go from the landing pages. And also where do the users drop-off or exit from the website.
Site Content in Behavior
The site content in behavior can be described as reports which define which content is more engaging and operative.
Also it makes you understand if your content is really impressive to keep the users hooked or to inspire them to take some action on your website.
Content Drilldown in Site Content
This report concentrates on showing the behavioral performance of a parent group.
For example,
Main Service page, Blog page, About page etc. This way you can analyze which top section is performing better than others.
Landing Pages in Site Content
Landing pages are basically the starting pages or the entering pages engaged by a user.
This report emphases on the Acquisition-Behavior-Conversion prototype. Hence you can analyze and compare the effectiveness of the entry pages concerning to conversions.
By using the data in this report you can gain some very useful information about your landing pages.
For instance;
If your landing has high bounce rate then it may point to the fact that your either your landing page design is boring and unable to keep the users intrigued.
Or it does not have the content and CTAs placed in the right position for the users to take desired action.
Any of which indicates, time to redesign your landing page.
Exit Pages in Site Content
Exit pages are the pages from where a user decides to leave a website.
Now with the data associated with this report shows you which page has what percentage of exit rate.
This means,
How often a user is exiting from a given page.
And the most important part to give attention here is, that if a landing page has a high exit rate then you might have an alarming situation there.
Because;
You would definitely not want your users to drop-off from your important landing pages like, homepage, service page, about page etc.
On the other hand,
If the exit rate is high on a contact page, or a confirmation page then this is obviously a good news as the goal of conversion is achieved here.
Site Speed in Behavior
Site speed is an important Google Ranking factor. And as per Neil Patel:
47% of customers expect a web page to load in 2 seconds or less.
If an e-commerce site makes $100,000 per day, a 1 second page delay might possibly cost you $2.5 million in lost sales every year.
The above facts clearly show how important Website Speed Optimization is. But this requires technical knowledge to get it right.
For this reason consider taking professional help of a web developer in India to increase speed, which will thereby increase your ranking and sales.
Page Timings in Site Speed
By analyzing this report you can easily judge which individual pages are consuming the maximum time to load.
This way you and your developer can fix the pages which are costing the website with high loading time.
User Timings in Site Speed
By using this report a website owner can calculate the timing of particular events or user interactions.
To use and study the report in totality your web developer has to make some additional set-up.
Site Search in Behavior
If a user lands on your website looking for something specific, then you can only assist them if you have an internal site search feature in your website.
This is extremely important because no user likes to waste time digging in page by page or category by category to get what he wants. Therefore, he will jump to other website.
Result: loss in sales.
Website owners definitely do not want this.
Now when a user types in a keyword in internal search box Google Analytics helps you locate those search terms by Site Search report.
But again, some settings have to be made your website developer before you start tracking the search queries.
Usage in Site Search
The usage report is a great way to analyze the data with the Acquisition-Behavior-Conversion itemization.
With the use of this analysis you can analyze and compare the data between visits that involved an internal site search and those that did not.
Search Terms Report in Site Search
By using this report you can gain insights about the most used search terms used by your users in the internal site search.
Along with this information you can also see other metrics associated like;
- number of times people searched your website,
- average number of times a user clicks on the search result page after performing an internal search
- number of times a user made an exit from a search result
- amount of time users spend on your website after getting the desired search result, and
- number of pages a user viewed from the search results.
All these are important analysis as this will deliver an important information about what your website visitors are looking in your website.
By reviewing this data you will get to know that users are interested in your website…
…but unfortunately;
The information/product/service they are actually interested in is not out there.
Meaning; the users are not able to find the information on their own, they had to look for it.
This ain’t good.
To improve this the website owners should improve their website navigation and User Interface so as to increase sales and conversion.
Search Pages Report in Site Search
With this report analyze which pages did visitors searched for in your website.
This again reflects the lack of information in the page that a user was viewing. And hence that user had to search for the related information in other page by typing it in the search box.
Events in Behavior
An event basically happens when a user interacts with your website without actually loading a page.
For instance,
Watching a video, playing a podcast, downloading a PDF/Word document, liking a social media page all come under events.
Here again you will need the help of your web developer to set up events in Google Analytics. And after setting them up you can track what all actions users are taking a specific page.
You will want to track anything that leads to conversion so as to improve it or add this value to other pages too. And events is an easy access to such reports.
For example,
Let us assume there is a video on your services page about how those can be useful to your users and obviously you want your users to watch it. Now how will you track the amount of play, pause and even exit on that video? Events report make that happen.
Top Events Report in Events
This reports calculates and shows the value of each event category.
With the help of this report you can judge which category event (e.g. Video or document or podcast etc.) is performing better than others.
Pages Reports in Events
Here you can see the pages where the events have occurred along with other metrics like; number of times event occurred in that page, event value and more.
Events Flow Report in Events
With this report you can see the path a user took before reaching to an event.
Publisher in Behavior
If your website has a publisher account (Google AdSense, Ad Manager) then ask your website’s developer to link that account with your Google Analytics account.
This way, with the help of this report you can assess the performance of the ads appearing on your website through clicks, CTR, eCPM, revenue and other calculations.
Experiments in Behavior
Like in other fields, Experiments in Google Analytics also mean to test different web page designs and compare which of them is most effective in converting visitors to consumers.
Google Analytics has an integrated setting to configure and test experiments on your website.
Just select a web page’s variants and you are good to test all the variations for their performance.
Typically Google Analytics has inbuilt setting to experiment 5 variations of a web page and perform maximum 12 experiments simultaneously.
Understanding Conversion in Google Analytics
So, a conversion happens when a user accomplishes a goal or an activity which is targeted towards the growth of the business.
Examples can be like,
Signing up for an email newsletter, buying an eCommerce product, watching a video, downloading an e-book and more.
Conversion can further be classified into two forms:
1. Macro Conversion, and
2. Micro Conversion
When a user purchases a product or a service from the website then it is a Macro Conversion.
And when he performs an activity like email newsletter signup or a social network like then this leads to a Micro Conversion.
Goals Report in Conversion
By studying the goals you can track how many times a visitor performs the desired actions on your website like filling a form or buying a product etc.
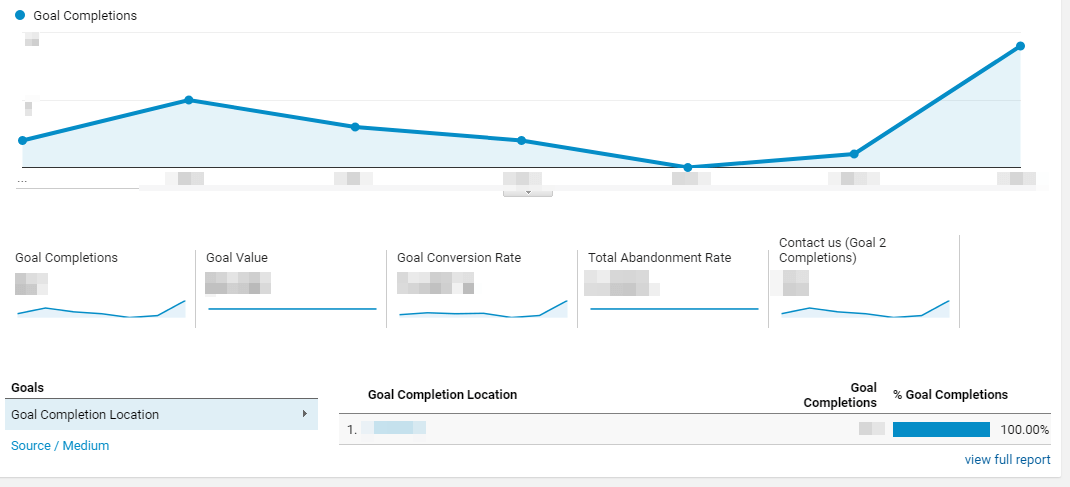
To measure goals, you first have to set up a Goal in your Google Analytics account.
How to set up goals in Google Analytics
Step 1
Start by going to the admin section in your Analytics account. In the right side you will find “Goal”, just click on it and it will lead to a new screen.
Here you will see add New Goal option, just click on it and you will see a screen like below:
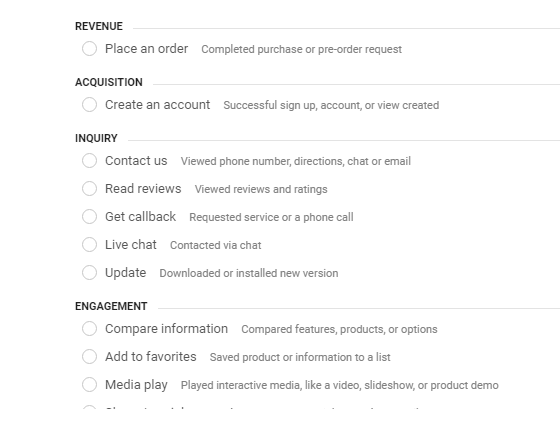
Select a template which best suits your goal format.
Step 2
Next you move onto filling in details about the goal template you have set in the initial step.
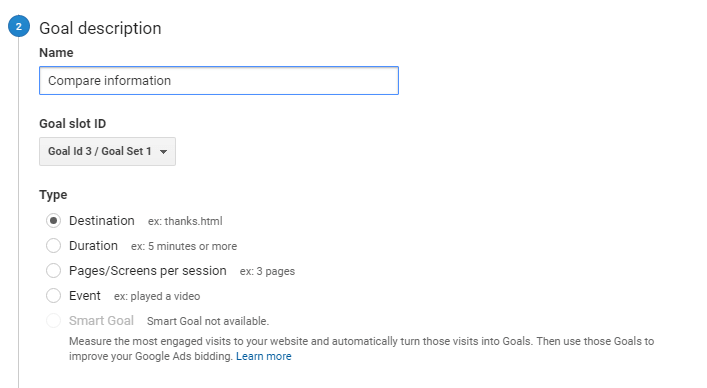
Here you will notice 5 types of goals. Choose them as per the below explanation:
Destination
Select this option if your goal is to track users to a particular destination.
This can be a confirmation page after purchasing, or a thank you page after subscribing or anything similar.
Duration
Choose this option if you want to analyze how much time a user spends on a web page in one session.
This can be set to 5 minutes or more or less depending on your requirement.
Pages/Screens Per Session
This option is chosen when a website owner wants to see how many number of pages or screens a visitors visits in one particular session.
Event
If you want to calculate events like a downloaded PDF or a played video or a podcast, then this is the right option for you to select.
Apart from all the above 5 types of Goals you will also see an option of Smart Goals.
Smart Goals
Smart Goals is a stress-free method to utilize and measure the most engaged visits in a particular sessions and automatically turns those visits into conversions.
These goals/conversions can then be used to enhance your Google Ads performance.
Step 3
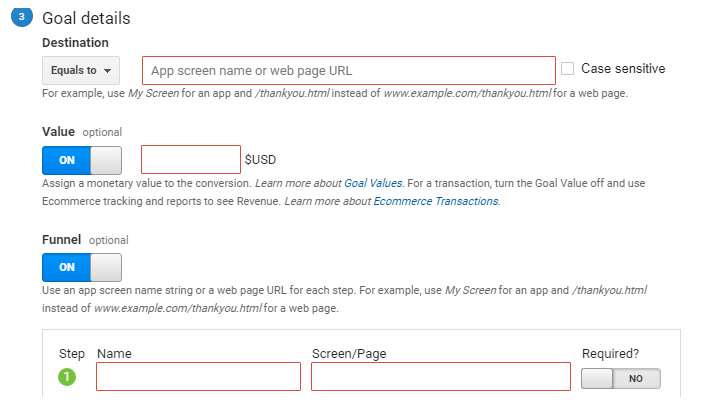
Moving on you will see the next step wherein you will have to fill the destination url, goal value and goal funnel.
Goal Value
Assign a monetary value to a goal to see how good or bad it is performing. For eCommerce transactions turn this off and track the revenue in eCommerce reports.
Example to assign a goal value:
If your in-house sales team is able to mature 7% of the leads captured through ebook downloads, and your average transaction is $700 then you could assign $549 (i.e. 7% of $700) to your events goal.
Further, if only 1% of downloads mature into a sale, then it’s good to assign $7 to your eBook download goal.
What is Funnel in Goals?
Funnel in Goals is the route taken by the visitors of a website to reach a destination page so as to complete a goal or an objective.
For example, a typical eCommerce site’s funnel can be like”
Product Page=>Add to Cart => Sign in/Sign up => Choose/Add Address => Payment Options => Confirmation Page.
Multi-Channel Funnels in Google Analytics
MCF reports in Google Analytics are used to gather insights about how your marketing channels (Organic, Direct, Paid) work together to generate sales and conversion.
The basis of MCF reports is the fact that a conversion (macro and micro) are most likely related to a last ad campaign run, or an organic search or a social media referral.
In all these instances a conversion is triggered by a channel or source.
By studying these reports you can also come to know about the actual time a user took between his past interest and his confirmation.
Attribution
It is the process of passing on recognition for sales and conversions to touchpoints in conversion paths.
By using attribution model marketers can measure the contribution each channel makes towards sales and conversion.