
Why a winning small-budget test doesn’t guarantee a winning big-budget campaign — and the pricing mechanics every advertiser should understand before pushing more spend into search, social, or display.
In this article
- The trap: judging a campaign by its smallest, cheapest phase
- Why campaigns almost always look good at small spend
- The ad inventory supply curve: the mechanic behind scaling
- The myth: “test small, then scale it”
- The campaign scaling S-curve
- The strategic fix: scale to your max CPL, not past it
- What it means if you can’t hit volume at your max CPL
- A practical scaling playbook
- Key takeaways
The trap: judging a campaign by its smallest, cheapest phase
One of the most common mistakes we see advertisers make, whether they’re running Google Search, Meta, LinkedIn, or programmatic display campaigns, is drawing big conclusions from a small amount of spend. A campaign launches, the first few hundred dollars go out the door, the cost per lead (CPL) looks fantastic, and the natural next move feels obvious: pour more budget in and watch the results multiply.
That instinct is understandable. It’s also, in a large share of cases, wrong. The purpose of this article is to explain why it’s wrong — not just as a rule of thumb, but as a consequence of how digital ad inventory is actually priced. Once you understand the underlying market mechanics, scaling stops being guesswork and becomes a strategic, defensible process.
Also read: Why Digital Advertising Costs Rise Even When Your Campaign Hasn’t Changed
Why campaigns almost always look good at small spend
There are two separate reasons early results are unreliable, and it’s worth separating them clearly.
First, statistical noise. A small number of clicks or conversions is a small sample, and such samples are inherently volatile. Marketing analysts widely note that testing with too few data points can yield results driven by random chance rather than a real underlying effect, and that this risk diminishes as the sample size grows[1][2]. A campaign that converts three out of five clicks in its first day hasn’t proven anything about its true conversion rate — it has produced a data point with a very wide margin of error.
Second, and more specific to paid media, is a pricing effect: at low spend, a campaign is only buying the cheapest, easiest-to-win slice of available ad inventory. This is the mechanism most advertisers overlook, and it’s the real subject of this article.
The ad inventory supply curve: the mechanic behind scaling
Every paid channel — Google Search, Meta, LinkedIn, programmatic display sells access to a finite pool of ad inventory for any given audience at any given moment. On real-time bidding exchanges, each individual ad placement is auctioned off the instant a user loads a page or opens an app, with the highest qualifying bid winning the impression[3][4].
Search auctions and social ad auctions work on the same underlying logic: advertisers compete for a limited number of eligible placements, and price is set by that competition rather than by a fixed rate card[5].
This has a direct consequence for scaling.
Not all inventory within a targeted audience is equally cheap. Some of it, the users most likely to convert, at the moments with the least competing demand, is cheap to win. The rest of it is more expensive, either because it’s contested by more advertisers or because it’s a lower-quality match for your targeting.
A small budget only needs to buy a small slice of inventory, so it naturally buys the cheapest slice available. A large budget has to buy much more of the available pool, which means reaching further into the expensive end of it.
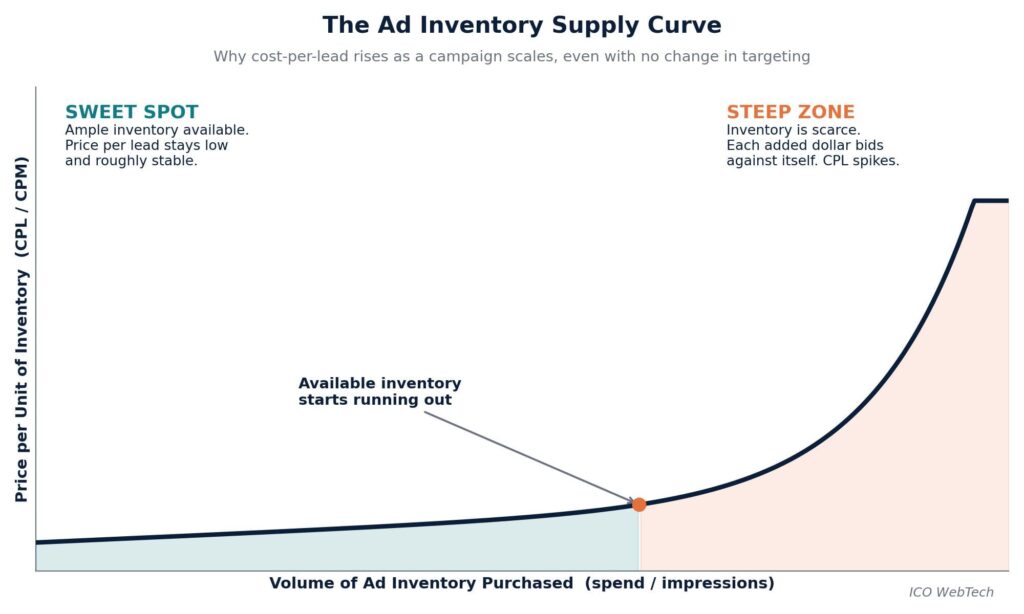
This is exactly the pattern paid media practitioners observe in the field. Analysis of scaled Meta campaigns has found that at lower budgets, ads reach the most responsive audience first; as spend increases, the platform is forced to bid for less qualified segments of its own auction, which drives cost up[6].
Independent case data tells the same story: one documented account saw CPL rise 80% after daily spend was scaled from roughly $500 to $4,000, with the later dollars far less efficient than the earlier ones[7].
The myth: “test small, then scale it”
The myth: “We tested this campaign at $50/day and it performed brilliantly. Let’s scale it to $2,000/day and expect similar returns.”
This logic assumes ad inventory behaves like a product with unlimited stock at a fixed price; buy more, get proportionally more, at the same cost. That assumption doesn’t hold. Because inventory is limited and priced by competitive demand, scaling isn’t a linear multiplication of your test results.
It’s a walk further along the supply curve in Figure 1, and depending on how much headroom exists in that specific audience, on that specific platform, at that specific moment, the walk can be short and cheap, or it can hit a wall very quickly.
This isn’t only a display/social-auction phenomenon.
Google’s own reporting acknowledges the same constraint for Search: the “Lost Impression Share (Budget)” metric exists specifically to show advertisers how much additional traffic is available at their current bids before they’d need to pay more to win additional volume[8] — a direct, built-in admission that available inventory at a given price is limited.
The campaign scaling S-curve
Put the pricing mechanic on a timeline, and it produces a recognizable pattern that paid media analysts refer to as the campaign S-curve, a non-linear relationship between spend and CPL that unfolds in three broad phases[9].
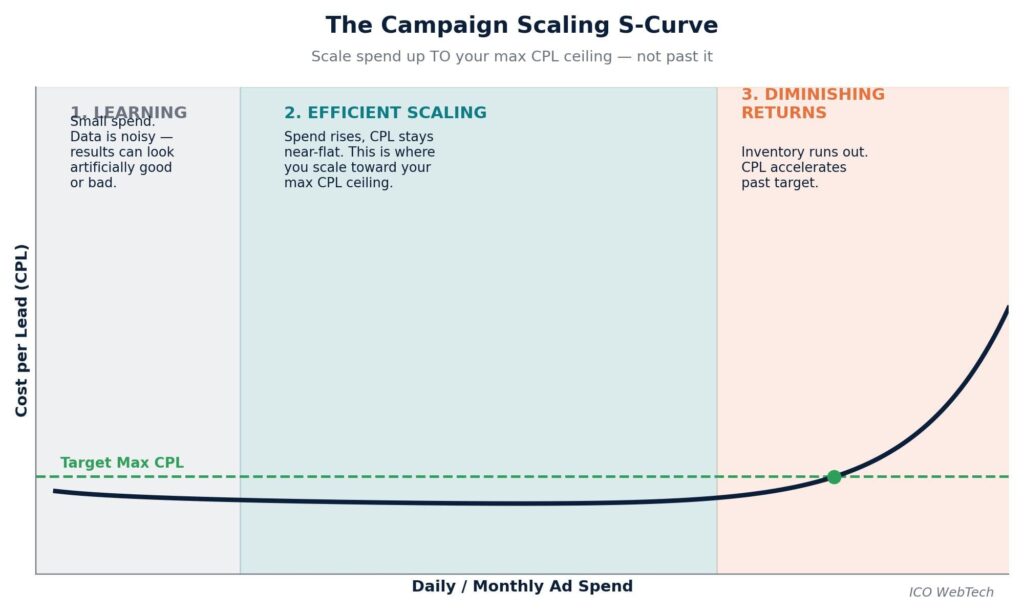
- Learning. Spend is low, data is thin, and results can look better or worse than they’ll ultimately be simply due to sample-size noise[1].
- Efficient scaling. The campaign has found its footing. Increasing budget produces a roughly proportional increase in leads, and CPL holds close to flat. This is genuinely the “golden zone” for scaling[9].
- Diminishing returns. The readily available, cheap inventory has been exhausted. Cost per click or cost per lead begins rising faster than spend, click-through rate tends to soften, and conversion rate on the newer, lower-intent traffic often declines[9].
Warning sign to watch for: a rapidly rising cost per click or cost per lead is typically the earliest, clearest signal that a campaign has crossed from Phase 2 into Phase 3 — auction pressure and audience saturation showing up in the numbers before anything else does[9].
The strategic fix: scale to your max CPL, not past it
This is the strategic takeaway for ICO WebTech clients: define your maximum acceptable CPL before you scale, not after. Without that ceiling set in advance, there’s no way to know when a campaign has reached its efficient sweet spot versus when it has been pushed past it.
You end up scaling reactively, watching CPL rise, and only stopping once it’s already uncomfortable — instead of scaling deliberately, toward a number you decided on with your margins and business goals in mind.
In practice, that means:
- Set the ceiling first. Work backward from your acceptable cost of customer acquisition to a maximum CPL you’re willing to pay.
- Scale in increments, not leaps. Documented case data shows that aggressive single-day jumps in budget (for example, quadrupling spend overnight) tend to push campaigns into unstable, inefficient territory, while gradual increases of roughly 10–20% every few days let the auction adjust without a shock to cost[10][6].
- Judge by marginal CPL, not average CPL. Your blended, account-level CPL can still look healthy even after scaling has gone inefficient, because it’s averaging the cheap early leads with the expensive later ones. The number that tells the truth is the marginal cost — what the most recent increment of spend cost to convert[11].
- Give a scale-up time to settle before judging it. Algorithmic ad platforms typically need a short adjustment window after a budget change; evaluating results too early repeats the same small-sample problem discussed above[12].
What it means if you can’t hit volume at your max CPL
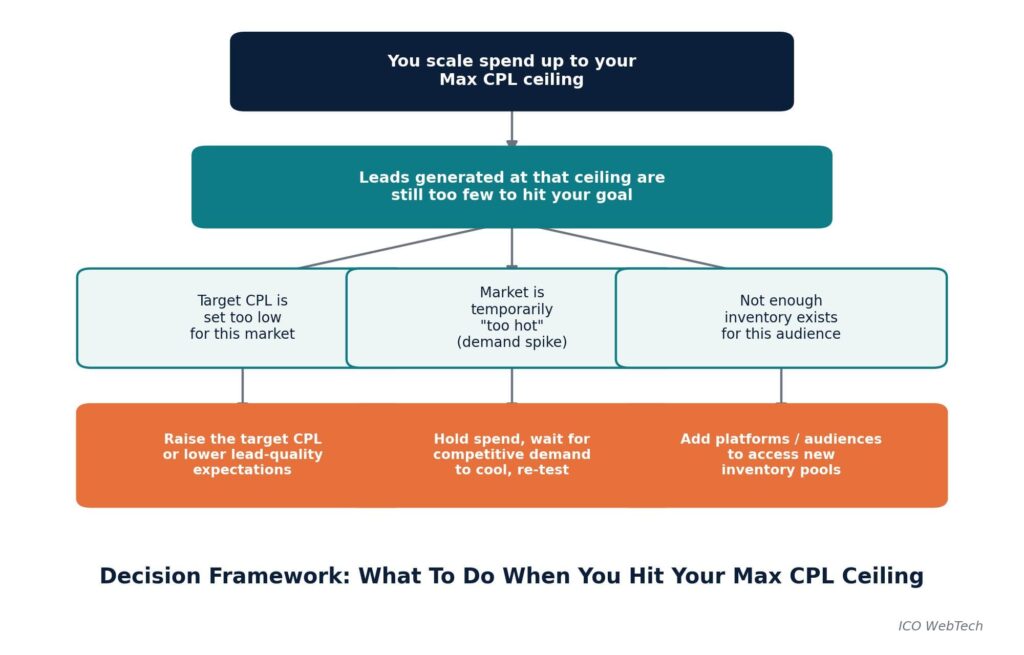
Suppose you scale spend all the way to your predefined max CPL ceiling, and the campaign still isn’t generating enough leads to hit your goal. That outcome is itself useful information; it tells you something specific about the market you’re in, not that paid media “doesn’t work.” There are three likely explanations, and each points to a different fix.
| Diagnosis | What’s happening | What to do |
|---|---|---|
| Target CPL is too low for the market | Your ceiling was set without reference to what this specific audience actually costs to reach right now. | Revisit the ceiling against realistic market pricing, or adjust lead-quality expectations. |
| The market is temporarily “too hot” | A spike in competitive demand, seasonal (e.g. Q4 retail), a competitor’s new campaign, or a category trend — is inflating prices across the board, not just for you. | Hold spend at the sustainable level, monitor, and re-test scaling once demand cools. |
| Not enough inventory exists for this audience | The addressable pool for this targeting, on this platform, is structurally too small to support the volume you need. | Expand to adjacent platforms or audience segments to access new inventory pools, rather than continuing to push price on a shrinking one. |
A note on seasonality and timing
Because price is set by competitive demand, the same audience can have very different headroom depending on when you test it. Scaling decisions made during a demand peak (holiday retail periods are the classic example) will show inflated costs that don’t reflect the account’s normal economics, while decisions made during unusually quiet periods can understate the true cost of scaling once competition returns to normal[9]. Where possible, validate scaling decisions during a representative, average-demand period rather than an extreme one.
A practical scaling playbook
- Run the learning phase long enough to trust the data — resist reacting to day-one or day-two results.
- Set a maximum CPL ceiling before scaling, based on your actual acquisition economics, not on the number your test happened to produce.
- Scale in moderate increments (roughly 10–20% every few days) rather than large jumps, and give each increment 2–3 weeks to stabilize before judging it[10][13].
- Track marginal CPL, not just average CPL, so you catch inefficiency before it’s buried in a healthy-looking blended number.
- If you hit your ceiling short of your volume goal, diagnose before you panic — is the target unrealistic, is demand temporarily elevated, or is the inventory pool structurally too small?
- Expand horizontally when a pool is saturated — new platforms, adjacent audiences, or additional creative variants — rather than continuing to push price on an audience that has run out of cheap supply[10].
Key takeaways
1. Early campaign performance is unreliable both because of small-sample statistical noise and because low spend only buys the cheapest slice of available ad inventory.
2. Ad inventory is priced by an auction, and it is finite for any given audience — which means CPL is not fixed as spend increases, and cost naturally rises once the cheapest supply is exhausted.
3. The strategic fix is to set a maximum acceptable CPL before scaling, and scale spend up to that ceiling — treating it as a deliberate target rather than discovering it by accident after costs have already spiked.
4. If you reach your ceiling without hitting your lead-volume goal, that’s diagnostic information — either your target CPL, the current market conditions, or the size of the addressable inventory pool needs to change.
Not sure where your campaign’s sweet spot ends?
ICO WebTech’s paid media team models the supply curve for your specific audiences before we scale a single dollar of client budget.
References
- “What Is Statistical Significance in A/B Testing?” MetricsWatch. Retrieved 2026. metricswatch.com
- “Statistical significance does not imply a real effect.” National Center for Biotechnology Information (NCBI). ncbi.nlm.nih.gov
- “YourAdvalue: Measuring Advertising Price Dynamics without Bankrupting User Privacy.” arXiv. arxiv.org
- “Scalable Bid Landscape Forecasting in Real-time Bidding.” arXiv. arxiv.org
- “Real-Time Bidding Explained: How Digital Ads Are Sold.” The Digital Bunch. thedigitalbunch.com
- “Meta ads scaling framework breaks at $5k spend.” Elite Brands. elitebrands.org
- “Diminishing Returns.” Saxifrage Blog. saxifrage.xyz
- “When to Increase Your Ad Budget: Signals That Tell You It’s Time to Scale.” Stackmatix. stackmatix.com
- “Diminishing Returns on Ad Spend: When to Scale and When to Stop.” Stackmatix. stackmatix.com
- “Scaling Ads Without Losing Profit: A Complete Guide.” Cometly. cometly.com
- “Meta Ads Optimization: Marginal CPA vs Average CPA Guide.” Get Ryze. get-ryze.ai
- “The Real Reason Your CPA Spikes at Scale and How to Fix It.” Aden’s Lab. adenslab.com
- “Diminishing Returns: Accounting for Channel Saturation.” Recast. getrecast.com



Related items
Your Google Ads Budget May Not Be the Problem Here’s a number worth paying attention to: t


Performance Max now manages more than 80% of ad spend for the median enterprise Google Ads

Key Takeaways Digital advertising prices are shaped primarily by auction dynamics, not fix