
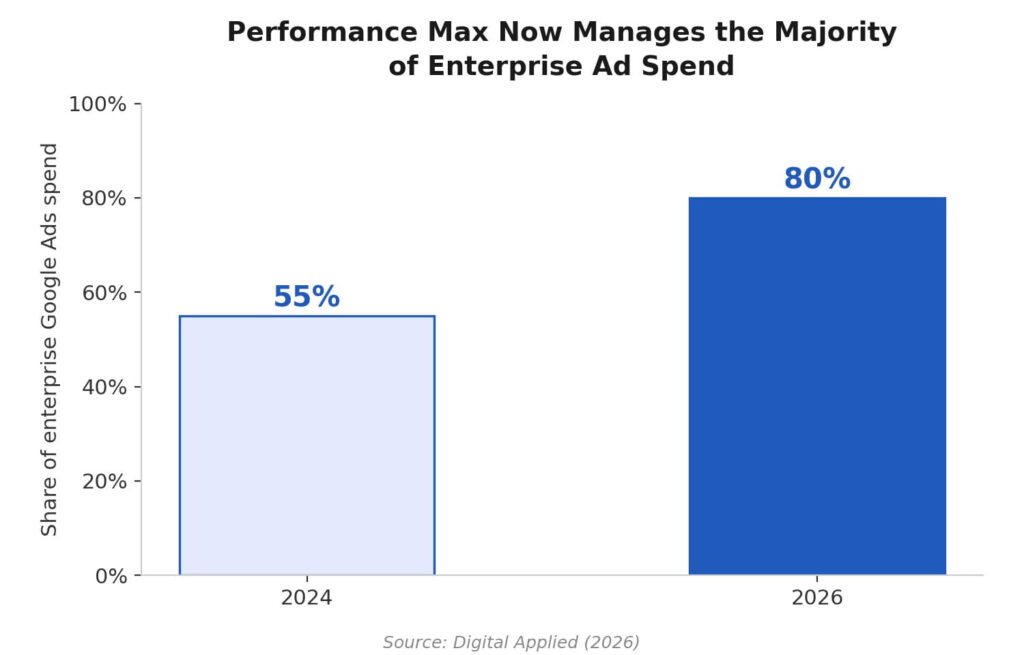
Performance Max now manages more than 80% of ad spend for the median enterprise Google Ads account, up from 55% just two years ago [1]. Smart Bidding handles 78% of all Google Ads spend across the platform [2]. Put plainly: the auction that decides whether your ad wins a click is no longer being run by a person. It’s being run by a model, in milliseconds, weighing more than 200 signals per query [3], and it’s making the bid decision your PPC manager used to make by hand.
It isn’t only bidding that’s changed hands. Google’s newer AI Max feature matches ads to queries an advertiser never typed into a keyword list at all, evaluating context and intent instead [8].
A campaign built around “trail running shoes” can now legitimately win an auction for “durable hiking running hybrids,” a query that was never targeted, was never tested, and doesn’t map cleanly back to any keyword report you’d have pulled two years ago.
Most of the industry has responded to that shift by getting better at feeding the machine. Fewer have stopped to ask a more uncomfortable question: if the algorithm is choosing the bid, the placement, and increasingly the creative combination, what exactly are we measuring when we report on CPC, CTR, or position?
Those numbers used to describe a marketer’s skill. Today they mostly describe the algorithm’s decision. Reporting on them as if they still reflect strategy is a little like grading a passenger on how well they steered a self-driving car.
This is the question we sit with on every account at ICO WebTech, and it’s the reason our reporting looks different. Below is the actual thinking, laid out plainly, along with the two frameworks we use to keep measurement honest when the thing doing the bidding isn’t a person anymore.
The metric you’re staring at might be the algorithm’s decision, not your strategy
Here’s the part that catches experienced marketers off guard. A campaign can post an 8x or 9x return on ad spend inside the platform and still be quietly underperforming the business goal it exists to serve.
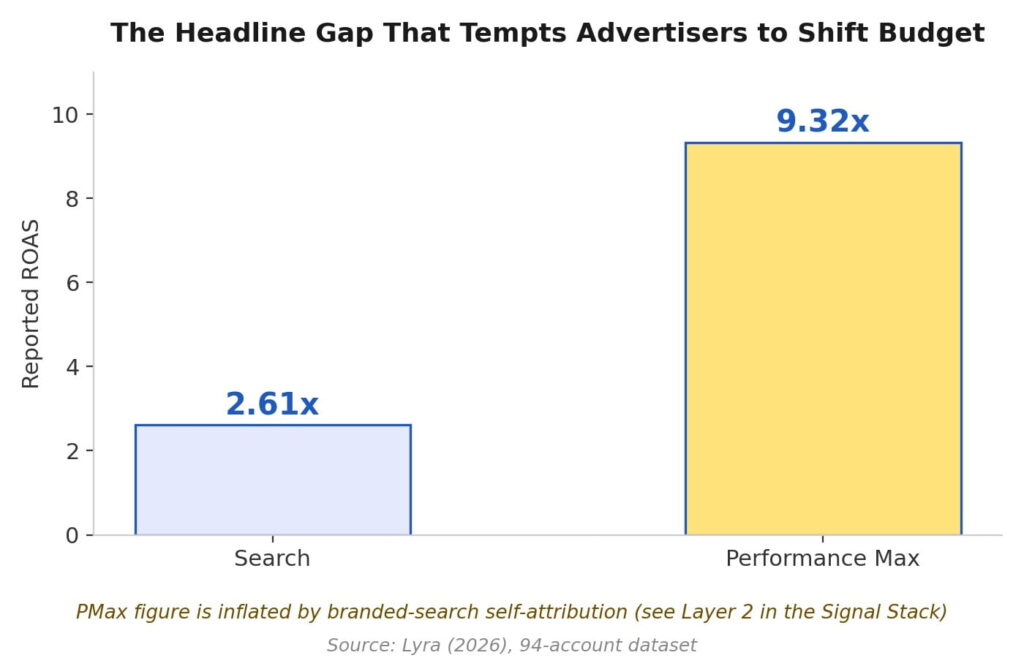
Performance Max campaigns have been shown to rely heavily on branded search queries, in which users are already typing a company’s name into Google [4]. Those clicks convert easily, because the person was already headed toward a purchase. The platform happily counts that conversion as a PMax win, and the reported ROAS climbs, even though the ad arguably contributed nothing beyond what would have happened anyway.
A recent audit of 94 live Google Ads accounts found Performance Max posting a 9.32x ROAS against Search’s 2.61x, a gap so large it would tempt almost any advertiser to shift budget wholesale into PMax [5].
But the same analysis noted the headline number hides real confounds, branded self-attribution chief among them. That’s not a knock on Performance Max as a tool. It’s a reminder that a platform-reported metric and a true incremental result are not the same thing, and treating them as interchangeable is how businesses end up congratulating an algorithm for selling to customers who were already sold.
Google has made real progress on transparency here, and it’s worth acknowledging. Channel-level reporting, search term insights, and asset-level data have all arrived over the past two years in direct response to advertiser pressure [6]. The old “black box” complaint isn’t entirely fair anymore. But visibility isn’t the same as action, and most teams still don’t use the data that’s now sitting right there in front of them. As one recent industry analysis put it, the problem has shifted from a lack of visibility to a lack of know-how [6]. The reports exist. Almost nobody is reading them the right way.
The Signal Stack: a framework for what to actually measure
We use a simple mental model with every client to sort out what’s actually worth watching, and we call it the Signal Stack. It has three layers, and the uncomfortable truth about it is that most reporting decks only ever show you the layer you control the least.
At the top sits Layer 3, business outcomes: cost per acquisition, ROAS, pipeline value. These are the numbers that show up in board decks and monthly reports, and they’re genuinely important. They’re also lagging indicators, and as the branded-search example above shows, they can be inflated by the very algorithm generating them.
Layer 2, in the middle, is auction behavior: impression share, search term composition, channel and placement splits. This layer is now visible thanks to Google’s reporting updates, but almost nobody looks here first, because it takes more effort to interpret than a single ROAS figure.
Layer 1, at the bottom, is your inputs: the quality of your conversion data, the audience signals you feed the algorithm, your creative assets, your exclusions. This is the only layer you fully control, and it’s where Google’s own guidance says the real competitive advantage now lives, since “the platform receives enough context to distinguish between high-quality and low-quality outcomes” only when the input data is clean [7].
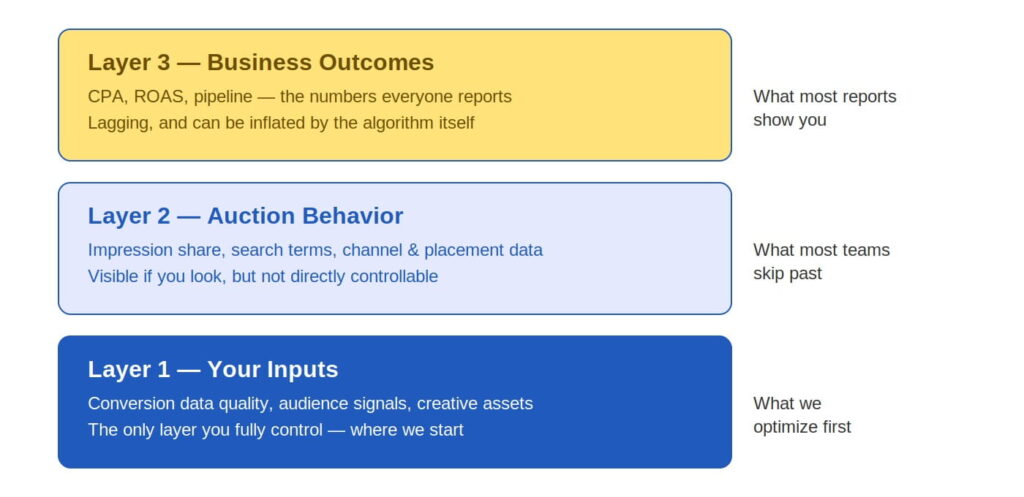
Most agencies report almost exclusively from Layer 3, because it’s the fastest layer to summarize in a slide. We start every account review at Layer 1, because that’s the layer where a genuine mistake or a genuine improvement actually originates. By the time a problem shows up in Layer 3, it’s already cost you weeks of spend.
The Black Box Audit: how we test what the algorithm is actually doing
Knowing where to look doesn’t automatically tell you what’s causing a shift in performance. Smart Bidding systems adjust dozens of variables simultaneously, which makes ordinary before-and-after comparisons nearly useless.
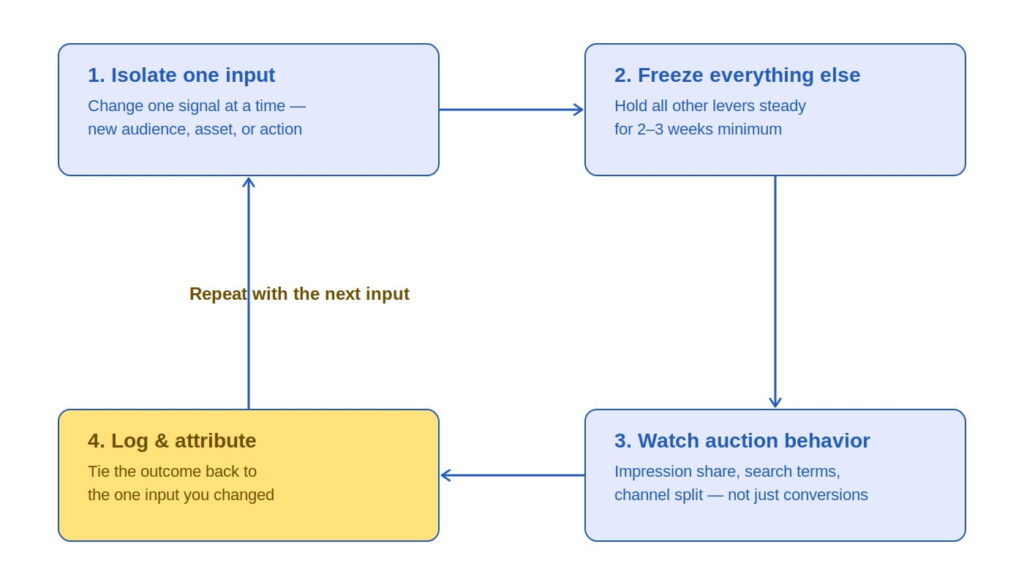
If you change your audience signals and your ROAS moves three weeks later, you have no way of knowing whether that shift came from your change, from a competitor’s bid adjustment, from a seasonal swing, or from the algorithm’s own ongoing learning process. So we run a disciplined, repeatable process instead of a guess, and we call it the Black Box Audit.
The process is deliberately unglamorous.
First, isolate a single input, one new conversion action, one new audience signal, or one new asset group, and change nothing else.
Second, freeze every other lever for a fixed learning window, typically two to three weeks, since Smart Bidding needs a consistent runway to relearn a pattern.
Third, and this is the step almost everyone skips, compare auction behavior rather than just the outcome. Did impression share shift? Did the search term mix change? Did the channel split move?
Fourth, log the result and attribute it specifically to the one input you changed, then move to the next variable. It’s slower than making five changes at once and hoping for the best. It’s also the only approach that lets you say, with any confidence, why a number moved.
Formal incrementality testing, geo holdouts, and branded-search suppression windows used to be out of reach for anything but the largest accounts. That’s changing. Google recently lowered the minimum spend required to run incrementality tests inside the platform to just $5,000 [8], which makes structured testing realistic for accounts that could never have justified it before. If you’ve been putting off finding out whether your conversions are incremental or just well-timed, the cost of finding out just dropped substantially.
Watching this play out with a B2B account
To make this concrete, here’s a composite example built from the patterns we see repeatedly across B2B accounts, not a single client’s exact figures, but an honest picture of how this plays out in practice. A mid-sized B2B manufacturer of industrial filtration equipment came to us with a Performance Max campaign reporting an 8x ROAS, a number their leadership team was, understandably, thrilled with. Sales, meanwhile, was asking a quieter and more pointed question: why hadn’t the volume of qualified engineering leads actually grown?
Running the Signal Stack, we moved past Layer 3’s flattering ROAS and into Layer 2. The search term insights report told a different story: nearly 40% of the campaign’s “high-performing” conversions were coming from branded queries, people already searching for the company by name, exactly the self-attribution pattern the industry has been flagging in Performance Max [4].
The algorithm wasn’t doing anything wrong by its own logic. It was simply optimizing toward the easiest conversions available to it, which happened to be existing brand awareness rather than new demand.
We ran a Black Box Audit against a single input: we added a tight negative-brand keyword list and rebuilt the audience signals around actual job titles and firmographics in procurement and engineering roles, then froze everything else for three weeks.
The reported ROAS dropped on paper, from 8x down to roughly 5x, which is exactly the kind of number that makes a client nervous during a monthly call. But sales-qualified leads from genuinely new accounts rose over the same period, because the budget was now finding people who’d never heard of the company instead of re-billing the company for people who already had.
The platform’s number got less impressive. The business result got considerably better. That gap is precisely why Layer 3 alone can’t be trusted as the whole story.
What this means if you’re the one signing off on the ad budget
None of this is an argument against automation. Advertisers using Smart Bidding report meaningfully better performance than manual bidding across nearly every recent benchmark, with some studies showing conversion lifts in the 20 to 40% range [3]. The algorithm is genuinely good at its job. The argument here is narrower and, we think, more useful: the algorithm’s job and your job are not the same job anymore, and your reporting needs to reflect that split honestly.
A few things follow from that, and they’re worth asking whoever manages your PPC account directly:
- Ask to see Layer 2 data, not just the ROAS summary. If your agency can’t show you search term composition or channel splits, they’re reporting on the algorithm’s press release, not its actual behavior.
- Ask when the last single-variable test was run on your account, and what changed as a result. If every optimization happens in a bundle of five changes at once, nobody can actually tell you what worked.
- Ask whether your reported ROAS has been checked against branded search volume. A high number driven mostly by your own brand name isn’t growth, it’s your existing reputation being counted twice.
- Ask what’s happening in your conversion data itself. Google’s own guidance is blunt about this: incomplete or inflated conversion signals teach the algorithm to optimize toward outcomes that look good but don’t reflect real business value [7].
The businesses getting the most out of AI-run auctions right now aren’t the ones spending the most. They’re the ones who’ve stopped treating the platform’s dashboard as the finish line and started treating it as one layer of a bigger picture, with the discipline to test what’s actually driving it rather than admire what it reports.
If your PPC reporting stops at ROAS and you’d like a second opinion on what’s really happening underneath it, our team at ICO WebTech will run a Signal Stack review on your account and show you exactly where the number is coming from. Book a free PPC audit here and see what’s actually driving your auction, not just what it’s reporting.
References
- Digital Applied. (2026). AI Google Ads bidding: PMax automation strategy 2026. https://www.digitalapplied.com/blog/ai-google-ads-bidding-automation-pmax-2026
- Digital Applied. (2026). PPC statistics 2026: 150+ paid search data points guide. https://www.digitalapplied.com/blog/ppc-statistics-2026-paid-search-data-points
- Get-Ryze.ai. (2026). Advanced Google Ads bidding strategies with AI 2026. https://www.get-ryze.ai/blog/advanced-google-ads-bidding-strategies-ai
- Search Engine Land. (2025). PMax and the illusion of trust: “I’m Google, what could go wrong?” https://searchengineland.com/google-pmax-trust-illusion-459833
- Lyra. (2026). State of Google Ads optimization 2026. https://www.lyrappc.com/reports/state-of-google-ads-2026/
- Smarter Ecommerce. (2026). 4 reasons why Google is no longer a “black box” (+ 4 problems that still exist). https://smarter-ecommerce.com/blog/en/google-ads/4-reasons-why-google-is-no-longer-a-black-box-and-4-problems-that-still-exist/
- Y77.ai. (2026). Google Ads trends 2026: AI Max, Demand Gen, PMax and what is actually changing. https://www.y77.ai/blogs/google-ads-trends-and-predictions-2026
- Osmundson, B. (2026). How to measure PPC performance when AI controls the auction. Search Engine Journal. https://www.searchenginejournal.com/how-to-measure-ppc-performance-when-ai-controls-the-auction/570184/



Related items

It is Monday morning, and a new proposal has landed in your inbox. It includes a fresh lin

Freelancer vs Agency vs In-House: How to Choose the Marketing Team That Fits Your Business Right Now
Gartner’s 2025 CMO Spend Survey found that marketing budgets average 7.7% of company reven

Driving traffic to your ecommerce store is only half the job. The harder part is getting t
