
A training lead at a sales company of about 200 people opens Google and types “best LMS for a sales team of 200”. Before she sees a single website, she gets a tidy AI answer with three vendor names and a price range.
Was your site in that answer? And if it was, did the answer get your price right?
That’s the question I keep coming back to, because in our research it isn’t an edge case anymore. It’s most of the searches that actually make money.
Where does the 85% figure come from?
It comes from our own study, The State of Content Marketing for Education Companies in 2026, published in June 2026. We evaluated close to 2,000 education company websites and coded around 1,000 education marketing job posts across 47 countries.
For the search part, we ran live probes of several hundred high-intent education queries in Google during the first half of 2026. High-intent here means decision-stage searches: “best LMS for…”, “employee training software”, “X vs Y”, “X pricing”, “X alternatives”. For each one we noted whether an AI Overview appeared, whether a traditional featured snippet appeared, and whether paid ads appeared.
AI Overviews showed up on about 85% of those queries. Featured snippets showed up on about 5%. Paid ads, about 25%.
Now the honest part. We flag this number as directional in the study, and I’d ask you to read it that way. Run the same query from London instead of Chicago, or next Tuesday instead of today, and you can get a different page, so treat 85% as the size of the pattern rather than a constant.
It’s also skewed. Most of the queries came from the edtech side: language schools, online learning, test prep, private K-12. Big campus universities? We covered them, but more loosely.
For context, Pew Research Center found AI summaries on 18% of all Google searches in its March 2025 data. So commercial education searches look far more exposed than search in general. That gap is the whole story, really.
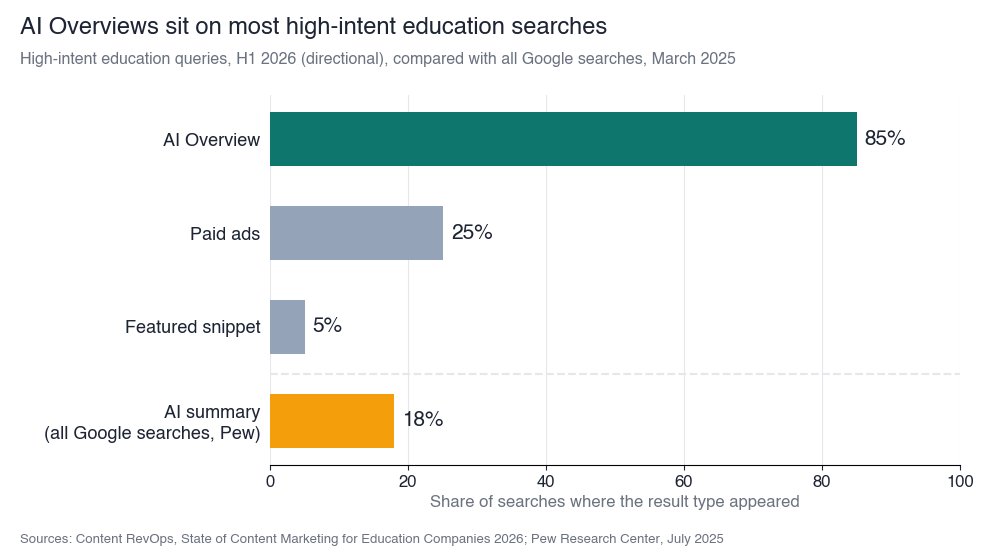 Caption: How often each result type appeared on high-intent education queries, next to Pew’s figure for all Google searches. Sources: Content RevOps, State of Content Marketing for Education Companies 2026 (directional); Pew Research Center, July 2025.
What actually changes for a website owner?
Three things, and only one of them is about traffic.
The click moves later, and fewer people make it. Ahrefs found that an AI Overview now correlates with a 58% lower average clickthrough rate for the top-ranking page, based on December 2025 data. Pew saw people click a traditional result on 8% of visits when a summary appeared, against 15% when it didn’t, and click a link inside the summary on just 1%.
The answer is built from facts, not from pages. I wish more site owners got this one. Leave your price off the site, and Google won’t politely leave a blank. It’ll grab a number from a competitor, a review site, or some Reddit thread from 2023.
In education, the missing facts are easy to count. Across the sites we reviewed, pricing showed up on fewer than 1 in 4. Comparison pages on about 1 in 20, ROI calculators on about 1 in 30, case studies on about 1 in 3, implementation guides on about 1 in 10.
Deep compliance coverage, the thing a district IT director actually wants to read, appeared on about 1 in 60. And awareness content outweighs decision content by more than two to one.
Meanwhile, answer engine optimization (the work of getting your facts into AI answers) shows up in about 1 in 80 education marketing job posts. So the channel that now sits on top of most buying searches is the one hardly anyone is hired to handle.
I don’t think education sites lost a ranking battle here. I think they never published the facts a buyer needs to decide, and the AI answer went and found them somewhere else.
What does an Answer Inventory look like?
Honestly, it’s a spreadsheet. Down the side go your money searches, across the top go the facts a decent answer would need, and in every box you ask: does our own site actually say this?
My rows are usually some mix of “best X for [segment]”, “X vs Y”, “X pricing”, “X alternatives”, plus the integration and compliance questions (“does X work with Salesforce?”, “is X GDPR compliant?”).
The columns barely change from client to client. Who’s it for. What does it cost, or at least how is it priced. How does it stack up. Proof, with real numbers. How painful is setup. And how do you handle data.
Then mark each box, and be strict about it. Stated: there’s a plain sentence on a page Google can crawl. Implied: it’s technically somewhere, maybe in a PDF, a slide, a demo video, or a paragraph so vague nobody could quote it. Missing: nope.
Where do the searches come from?
Not from a keyword tool, ideally. I start with sales call notes, then site search, then Search Console, and stop at 20 or 30.
It’s a little funny how quickly the same five questions turn up, just worded differently by every buyer.
Then go page by page and fill in the grid. If the only place a fact lives is the sales deck, that box is Missing. I know, it hurts.
What do you fix first?
The Missing boxes, and you fix them with decision-stage pages: pricing, comparisons, case studies with numbers, implementation guides, a compliance hub. Then write each fact as a sentence an answer can quote.
“Plans start at a set price per learner per year for teams of 50 or more” is quotable. “Contact us for pricing” isn’t, and it’s exactly the line that hands the answer to someone else.
Here’s the example I see most. An LMS vendor’s pricing page says “talk to sales”. So when someone searches “[vendor] pricing”, the Overview fills that cell with a range from a review site, often out of date, or with a competitor’s published price sitting right next to their name.
The vendor didn’t choose that framing. They just left the cell empty.
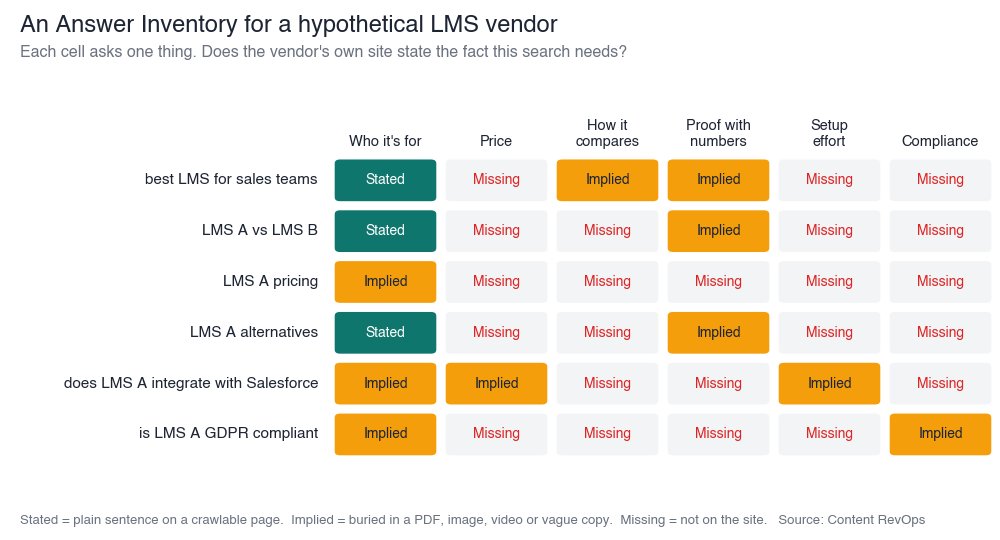 Caption: An Answer Inventory for a hypothetical LMS vendor. Each cell shows whether the fact a buyer needs is stated plainly, implied, or missing on the vendor’s own site. Source: Content RevOps.
How does the Probe Loop work?
The Answer Inventory tells you what’s missing. The Probe Loop tells you whether fixing it changed anything. It’s the measurement method we use in our audits, cut down so any team can run it.
First, pick your searches. Somewhere between 50 and 200 money searches is plenty, sorted by type and by who’s asking (a district buyer and a corporate L&D lead won’t type the same thing).
Second, probe live. Run each query in Google, ChatGPT, Perplexity, and Gemini, logged out, with a fixed location. Run each one three times on different days.
Why three? Because answers move. I’ve watched the same query name a client on Tuesday and drop them on Thursday, and a single run would have told two completely different stories.
Oh, and please don’t test this from your own logged-in ChatGPT. It knows what you’ve been searching for and it’ll cheerfully show you your own company. Use a clean session, or the APIs if you’ve got someone technical.
Third, count three things. Presence is the share of queries where you’re mentioned at all. Then citations: how many times did the answer actually link to you? And then the one people skip, is what it said about you even true?
That last one matters more than people expect. Being mentioned with the wrong price can be worse than not being mentioned.
Fourth, chase the misses. Every search where you didn’t show up, or showed up wrong, leads straight back to an empty or half-empty box in the Answer Inventory. Most teams I’ve done this with expected a mountain of work and got a list of maybe a dozen pages.
Fifth, fix things and run it again next month. And look at the trend over several runs. One good Thursday doesn’t mean much.
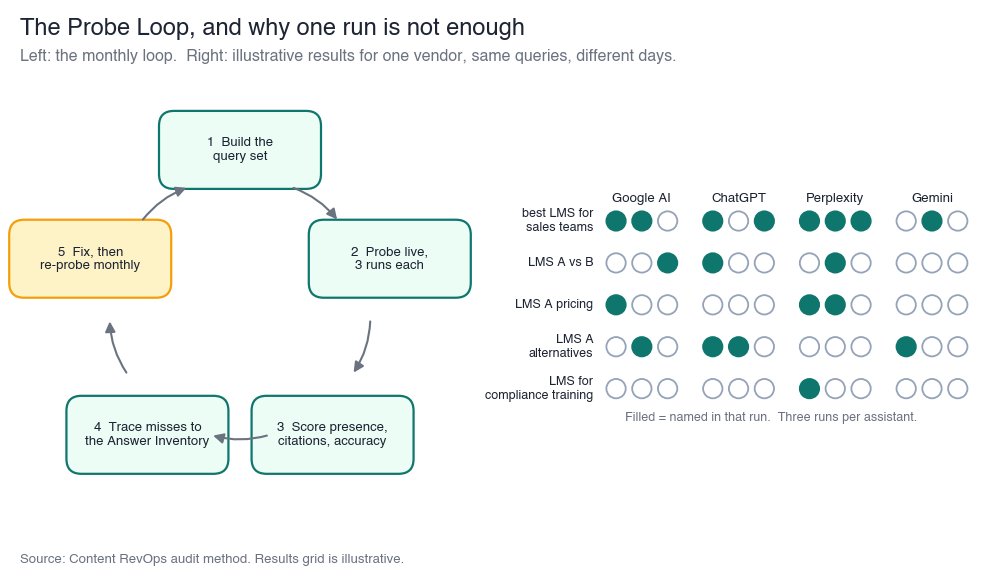 Caption: The Probe Loop, with a sample results grid of queries by AI assistant by run. Presence changes from run to run, which is why a single check can mislead. Source: Content RevOps.
What do the clicks that survive need?
Here’s the bit of good news. The people who still click after reading an Overview are further along. They’ve stopped browsing. They want to check one thing, usually a price, whether you fit, some proof, or how to book a demo.
Most education sites aren’t built for that visitor. The study scored conversion architecture at 1.88 out of 4. About 1 in 13 articles had no conversion path at all, and only about 1 in 20 sites used strong calls to action matched to the buyer’s stage.
So the practical rule is simple. Every decision-stage page needs one clear next step that matches the question the visitor came to check. If they came for pricing, don’t send them to a newsletter sign-up.
Has this worked anywhere outside a spreadsheet?
It has. Here are two I know well, and I’ll keep them short.
Banking Crowded (fintech media and intelligence) built a resource hub from real sales call insight, written to rank and to be cited by AI tools. Over 12 months, about 22% of inbound traffic came from AI and LLM referrals, and leads from those referrals converted at about five times the baseline rate. Inbound leads went from about 15 a month to 120 to 150. The Banking Crowded case study has the detail.
Ori Learning (K-12 edtech) had a rough 2023. A rebrand wiped out more than 80% of its organic traffic. What brought it back was a hub of 200-plus articles and tools, each one built around a problem a school leader actually has, wired so that when someone engaged, sales heard about it. A year later organic traffic was up about 4,500%, per the Ori Learning case study.
Neither of those started with “let’s do AI search”. They started by publishing what buyers actually needed to know, in a form both people and machines could use.
So where does that leave website owners?
I think the sites that win the next two years of education search won’t be the ones publishing the most. They’ll be the ones publishing the decision facts nobody else bothers to publish, and then checking, month by month, whether the answers actually use them.
Build the inventory. Run the loop. And if a fact matters to the buyer, write it down where a machine can read it.


Related items
Baymard Institute’s 2026 benchmark found that 52% of desktop sites and 62% of mobile sites

Depending on which 2026 survey you read, somewhere between 34% and 77% of US shoppers have
Websites were built around a human operating the interface. A visitor reads the page, comp
