
At a glance
Every 100 milliseconds of load time costs roughly 1% in conversions [1]. A one-second delay costs about 7% [2]. For most businesses, page speed isn’t a technical nice-to-have; it’s a direct, measurable tax on revenue, and most sites are paying it without knowing the size of the bill.
This post shows you the real relationship between website speed and conversion rate, the “speed tax” framework we use to put a dollar figure on it, and the one measurement trap that fools even careful marketers into thinking their site is faster than it actually is for real visitors.
In this blog:
- The real relationship between speed and conversions
- What “slow” actually means in 2026
- The speed tax: putting a number on what slow costs you
- The lab-versus-field trap
- Where speed actually breaks on most sites
- Fixing it without necessarily rebuilding anything
The real relationship between website speed and conversion rate
This is the fourth post in our website redesign series on icowebsolutions.com. We’ve covered how to spot a site that’s hurting conversions, whether the fix is a redesign or a rebuild, and how UX friction quietly costs you leads. Page speed connects to all three, because it’s often the single fastest, most measurable lever behind each of those problems, and it’s usually the easiest one to prove with hard numbers.
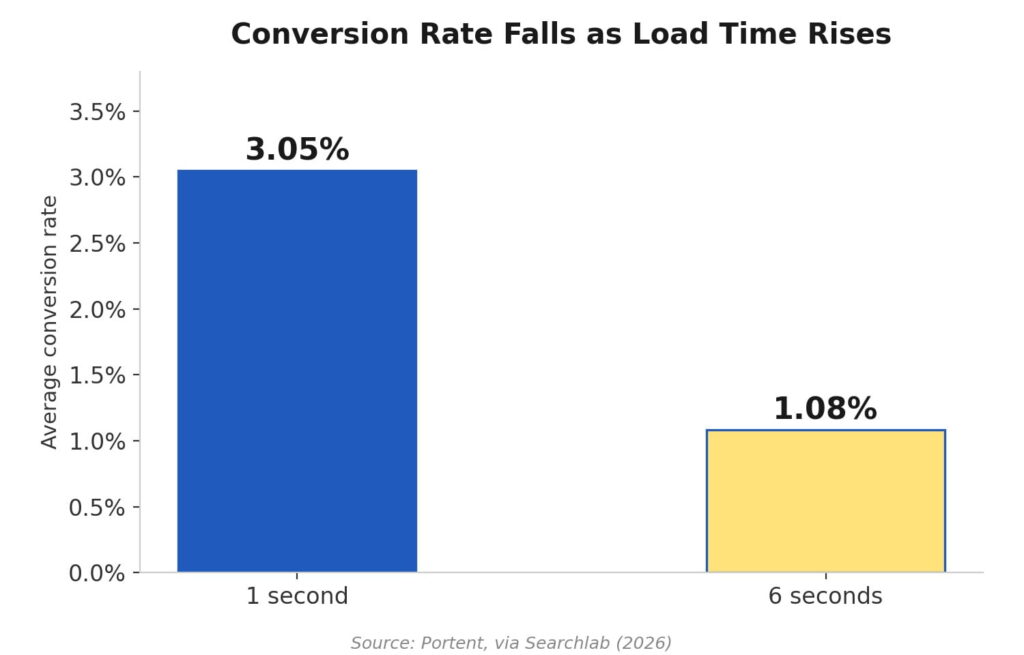
The data on this is about as unambiguous as marketing data gets. Pages that load in one second convert at roughly 3.05%, while pages that take six seconds convert at just 1.08%, a drop of nearly two-thirds [3]. Walmart found that for every one-second improvement in load time, conversions rose by 2% [4].
Mozilla trimmed 2.2 seconds off Firefox’s average load time and saw download conversions climb 15.4% [1]. These aren’t small-sample studies or isolated anecdotes. They’re consistent findings across retail, software, and media, spanning more than a decade of testing.
The pattern holds regardless of what kind of website you’re running- ecommerce, SaaS, lead generation, or a services business- because the underlying mechanism is the same everywhere: attention decays fast, and a page that hasn’t shown anything yet is asking for patience most visitors don’t have.
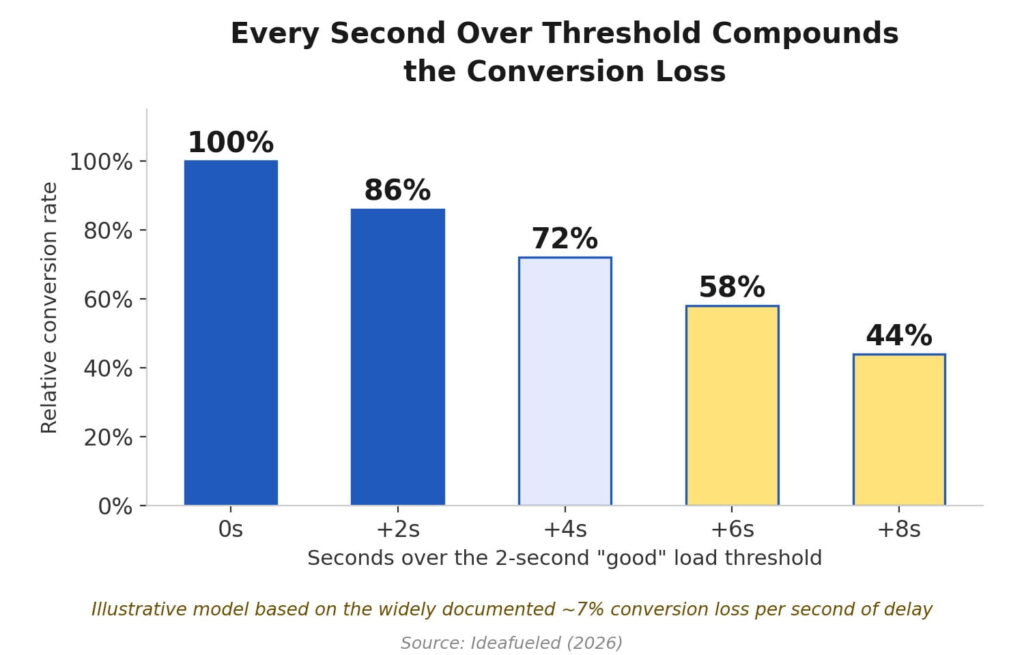
The probability that a visitor bounces increases by 32% just going from a one-second load to a three-second load [5], and every additional second adds to that. That’s why the roughly 7%-per-second conversion loss cited earlier adds up so quickly once a page drifts even a few seconds past the good threshold.
What “slow” actually means in 2026
“Slow” used to be a vague, subjective complaint. Google has since turned it into three specific, measurable numbers, collectively called Core Web Vitals. Largest Contentful Paint, or LCP, measures how long it takes the main content of a page to become visible, and Google’s “good” threshold tightened from 2.5 seconds to 2.0 seconds in the March 2026 core update [6].
Interaction to Next Paint, or INP, measures how quickly a page responds once someone actually clicks or taps something. Cumulative Layout Shift, or CLS, measures how much the page jumps around while it’s loading, the reason your thumb sometimes taps the wrong button because an image finally rendered underneath it.
Most sites are still failing this test. Only 42% of mobile sites pass all three Core Web Vitals, compared with 63% of desktop sites [1], and mobile now accounts for the majority of eCommerce traffic, which means the worst experience is landing on the majority of visitors.
Passing all three matters beyond vanity: sites that meet the Core Web Vitals thresholds see 24% lower bounce rates than sites that don’t [1], and layout instability alone, a CLS score above 0.25, is tied to 38% more users leaving the page prematurely [1].
The speed tax: putting a number on what slow actually costs you
Most site owners have never seen their page speed problem expressed in the only unit that actually gets a budget approved: dollars. So we built a simple framework we walk every client through, and we call it the Speed Tax.
It takes the well-documented finding that each second of load time beyond Google’s “good” threshold costs roughly 7% in conversions [2] and turns it into a monthly number specific to your business.
The math is deliberately simple. Start with your average monthly revenue from the website. Multiply that by 7% for every second your Largest Contentful Paint sits above the 2.0-second good threshold. The result is your Speed Tax, the revenue you’re quietly losing every month to load time alone, separate from anything to do with your offer, your pricing, or your sales team.
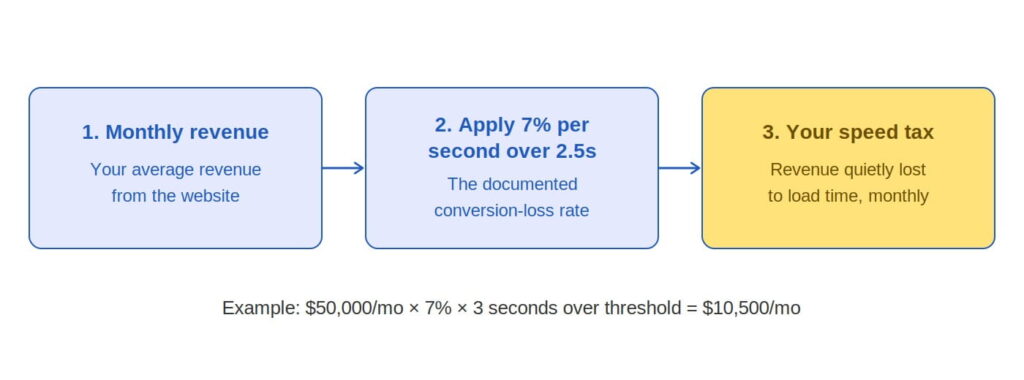
Here’s what that looks like with round numbers.
A business generating $50,000 a month from its website, with an LCP sitting at 5.5 seconds, three and a half seconds over the good threshold, is paying a Speed Tax of roughly $10,500 a month, or well over $120,000 a year.
That’s not a hypothetical. For a $10 million-a-year eCommerce site, a 500-millisecond improvement alone has been shown to recover around $500,000 in annual revenue [1]. The number is large enough that it’s genuinely strange how few businesses have calculated their own.
Also read: Ecommerce Security Secrets: How Top Brands Keep Their Sites Safe
The lab-versus-field trap almost every business falls into
Here’s the part we think deserves more attention than it gets, because it quietly undermines a lot of well-intentioned speed work. Most businesses check their site speed by running a quick scan in a tool like Google PageSpeed Insights and chasing a high score.
That score is lab data: a single simulated test, run under fixed conditions, on Google’s servers. It’s useful for diagnostics, but it is not what your actual customers are experiencing.
Real user experience comes from field data, specifically the Chrome UX Report, or CrUX, which aggregates how actual visitors experienced your site on their actual devices and networks [2]. A site can score 95 out of 100 in the lab and still fail Core Web Vitals in the field, because the lab test doesn’t account for someone on a three-year-old Android phone on patchy 4G in a market your business actually sells into.
Chasing a perfect lab score while ignoring field data is a little like tuning a race car for a track you’ll never actually race on. It feels productive. It doesn’t move the number that matters.
If you only check one thing after reading this post, check your site’s real field data in Google Search Console’s Core Web Vitals report, not just a synthetic PageSpeed score. That’s the number your actual customers are living with, and it’s the number tied to the conversion data above.
Where speed actually breaks on most sites
Speed problems tend to concentrate in a small number of predictable places, and most of them are fixable without touching your platform or your design. The average mobile page still takes 8.6 seconds to load and weighs more than 2.3 megabytes [1], and that weight has to come from somewhere specific.
- Unoptimized images are the most common cause of a failed LCP score, and proper compression alone can improve LCP by 30 to 50% on most sites [3].
- Excess JavaScript is close behind; the average site now ships close to 490 kilobytes of it, up 23% since 2022 [3], much of it from plugins and trackers nobody remembers adding.
- Render-blocking scripts and stylesheets delay the moment your main content can even start painting on screen.
- Slow server response time, particularly on shared or budget hosting, adds delay before the browser has anything to work with at all.
- Unstable layouts, images and ads without reserved dimensions, cause the page to jump exactly as someone is about to click.
Real fixes are proving out at scale, not just in theory. Rakuten 24 ran a controlled test on Largest Contentful Paint and saw revenue per visitor rise 53.37%, with conversion rate up 33.13%, from performance work alone [2]. Vodafone Italy improved LCP by 31% through server-side rendering and cutting render-blocking JavaScript, and picked up an 8% lift in sales [2]. RedBus focused specifically on interactivity and saw a 7% increase in sales after improving INP [2]. None of these required starting over. They required finding the specific bottleneck and fixing it.
Fixing it without necessarily rebuilding anything
The reassuring news, consistent with what we’ve said throughout this series, is that speed problems rarely require a full platform rebuild. Most of the fixes above, image compression, script cleanup, layout stability, live in the same layer a focused redesign or a technical tune-up already touches.
What’s genuinely surprising is how little attention this gets given the size of the number attached to it: only 3% of marketers currently list speed as their top priority [1], even though the revenue case is stronger and easier to prove than almost anything else on a typical marketing roadmap.
If you don’t know your site’s current Speed Tax, that’s the first thing worth finding out, before you spend another dollar on traffic or another hour debating a redesign. Our team at ICO WebTech will run your site’s real field data, calculate your specific Speed Tax, and show you exactly which fixes would pay for themselves fastest. Book your free speed audit here and find out what your load time is actually costing you.
Also read: Tired of Website Downtime? How ICO WebTech Ensures 99.9% Uptime
References
- Digital Applied. (2026). Page speed statistics 2026: Performance and revenue impact. https://www.digitalapplied.com/blog/page-speed-statistics-2026-revenue-impact
- Ideafueled. (2026). Core Web Vitals 2026: Fix speed or keep losing traffic. https://ideafueled.com/blog/core-web-vitals-2026-explained/
- Searchlab. (2026). Website speed & performance statistics 2026. https://searchlab.nl/en/statistics/website-speed-performance-statistics-2026
- Colorlib. (2026). 50+ site speed statistics: Page load, CWV & performance (2026). https://colorlib.com/wp/site-speed-statistics/
- SiteBuilderReport. (2026). 20+ interesting website speed statistics (2026). https://www.sitebuilderreport.com/website-speed-statistics
- BloggerSideas. (2026). 80+ page speed and Core Web Vitals statistics 2026. https://www.bloggersideas.com/page-speed-core-web-vitals-statistics/



Related items

Depending on which 2026 survey you read, somewhere between 34% and 77% of US shoppers have


Websites were built around a human operating the interface. A visitor reads the page, comp


In a Harvard Business Review audit of 2,241 US companies, only 37% answered an online inqu
